_edited.jpg)
FIND TALENT
Your dream candidate is just around the corner.
TECHNICAL ANALYSIS
All of the equations and work done to create the best product possible
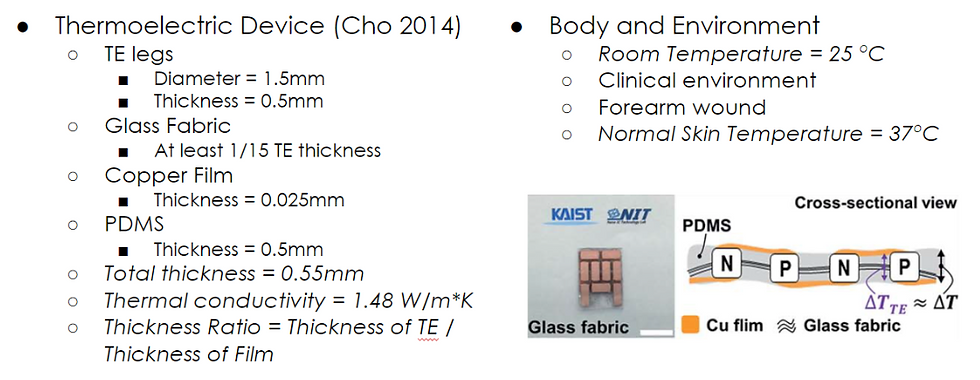
Assumptions
The properties and dimensions of the thermoelectric (TE) device were taken from the research paper published in Energy and Environmental Science called A Wearable Thermoelectric Generator Fabricated on a Glass Fabric written by Sun Jim Kim, Ju Hyung We, and Byung Jin Cho.
Assumptions for Simplification:
-
The product will be used for a forearm wound
-
The product will be used in a clinical environment
Heat Transfer Analysis

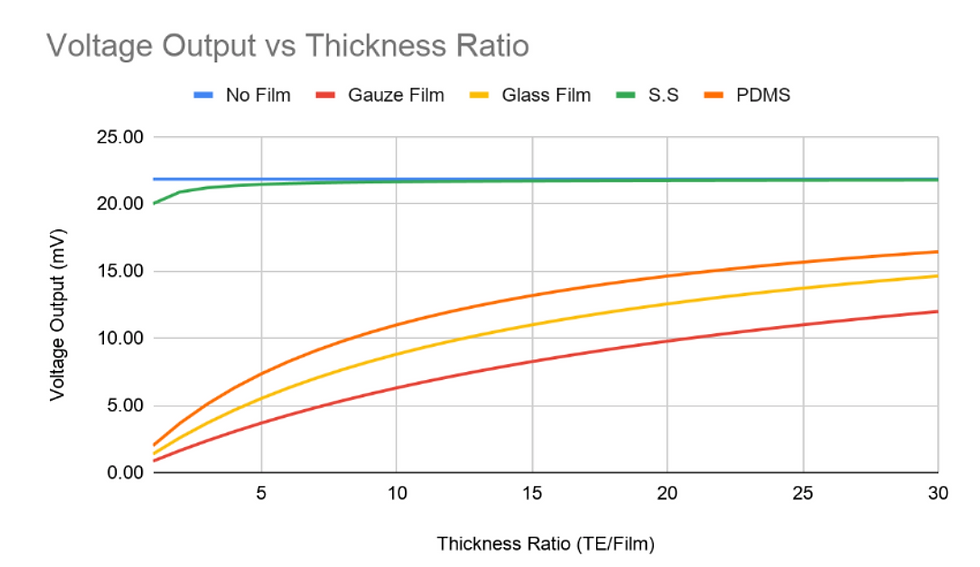
With the assumptions and constraints in mind, the group the group modeled the TE device accordingly with plane wall resistance heat transfer techniques for conduction. The temperature difference across the TE device was found and converted to voltage via the relationship provided in the paper mentioned previously. Next, the group determined how the voltage output was affected by three factors: area, resistance, and the thickness ratio. The area refers to the area in contact with the skin, the resistance is with respect to adding a film layer in between the skin and the TE device, and the thickness ratio is the ratio between the TE thickness and the film thickness. The group determined that the area has no effect on the voltage produced since the heat transfer will depend primarily on the thickness. In terms of the additional film layer, the group compared five models: no film, gauze, glass fabric, stainless steel, and PDMS. It was found that the stainless steel has the best voltage output, then PDMS, glass, and finally gauze. In terms of adjusting the film thickness in terms of the thickness ratio, each material appears to follow a logarithmic trend but as the thickness ratio increases, so does the voltage output. These results are also shown in the images.
Stress Analysis
End- Bending Stress
Middle- Bending Stress
End Deformation

Factor of Safety- Static Bending
Middle Deformation

Factor of Safety- Middle Bend
Solidworks static analysis was run to look at the mechanical ability of the TE device. First, the response to a force at the edge opposite a fixed edge was looked at. This shows large deformation, which was expected. Additionally, this provided a factor of safety of above one so the device will not fail in this scenario. Next, it was run with the outside edges of the device fixed, as it would be by adhesive, with a distributed force over the area. This would normally have a spring support, the skin, but the analysis was run to represent the worst case scenario. The results presented large deformation again, but the factor of safety was above one. Even in the worst case, the device would not fail in this situation.
Power Analysis
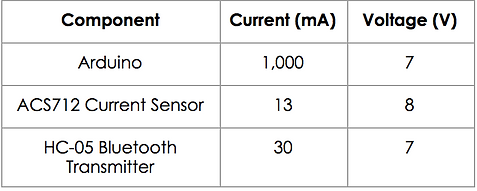
The group conducted power supply analysis to understand voltage and current requirements of the design. There are three components are necessary to be taken into account. The Arduino would read the voltage output of the TE, convert it into a signal, and send a signal to a device, such as a phone. The ACS712 current sensor would be to measure the current generated by the TE. The HC-05 bluetooth transmitter would be the component that would deliver the signal to the device. Data sheets for each respected component were used to find the maximum operating current and voltage, these can be seen in the table above.
The design would incorporate a single Arduino, two current sensors, and a bluetooth transmitter. The current sensors will be in parallel, meaning the required operating current and voltage would be 26 mA and 8 V. In total the current and voltage required for TEG is 1056 mA and 22 V respectively. In order to satisfy the voltage requirement for all the components 1,008 TE’s would have to be manufactured and connected in series. The amount of TE devices required to generate a sufficient voltage to power all the components is impractical. An alternative design would have the TE device only act as a signal while a battery would be used as a power source for the components.
Software Flowchart

The logic flow chart was created to lay out the code before the code is written. The general steps for the flow chart are as follows:
1. The Thermoelectric generators will generate a voltage from the wound and skin, separately.
2. The voltage sensor will create a signal that the bread board can read for each voltage created.
3. The voltage value history will be recorded for each TE device.
4. The voltage difference between the wound TE's voltage and skin TE's voltage will be calculated.
5. If the voltage differences are significantly increasing as time goes on, the application will alert the user that they have an infection. If the differences are not significantly increasing, continue monitoring.